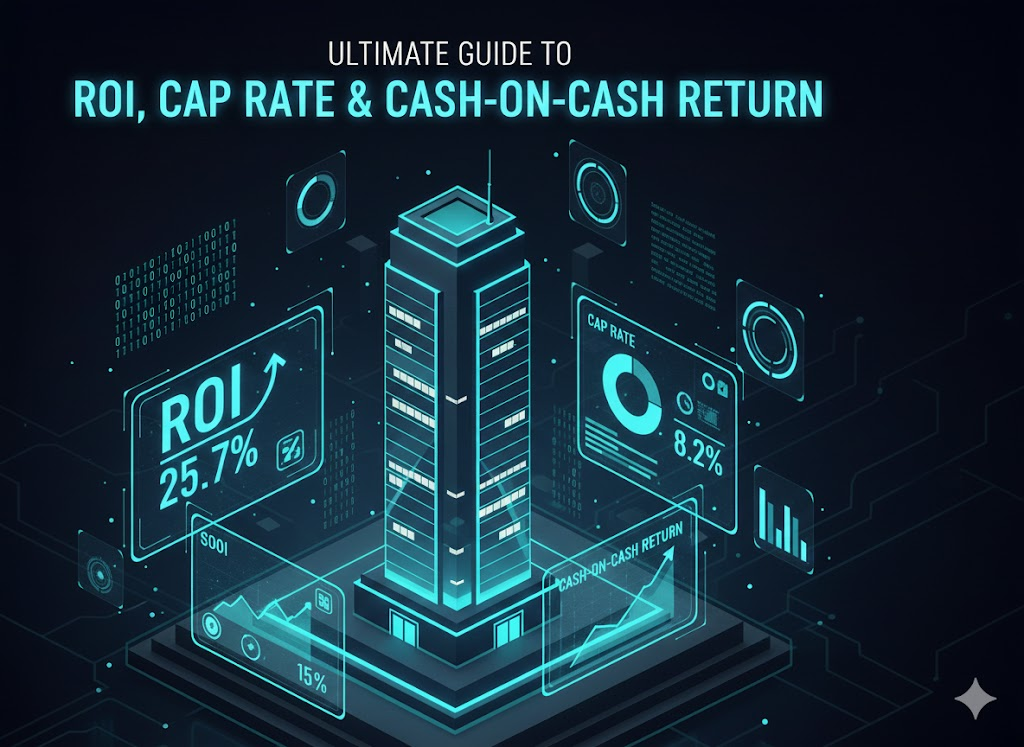
The Ultimate Guide to ROI, Cap Rate & Cash-on-Cash Return (Investor Math That Actually Matters)
Introduction
Every real estate investor knows the terms ROI, cap rate, and cash-on-cash return — but very few understand how to calculate them with the precision of today's market demands. These aren't just formulas; they are the diagnostic tools that determine whether a deal becomes a wealth-building asset or a slow-moving financial liability. In a landscape where mortgage rates hover between 6.5–7.5%, insurance premiums in Sunbelt states have jumped 15–30% year-over-year, and vacancy rates are trending upward at 6.6% nationally, a single miscalculated assumption can distort your entire investment thesis.
The truth is simple: investors who rely on outdated spreadsheets, seller pro formas, or best-case-scenario rent estimates are playing a dangerous game in 2025. The winners are the ones who understand their numbers deeply and analyze deals with the same rigor used by institutional buyers — now possible through platforms like Serava and the ROI Calculator at /roi-calculator.
This guide breaks down the three most essential investment metrics with the clarity of an expert underwriter and the context of today's data-driven market conditions. If you want to elevate your decision-making and avoid the costly mistakes most investors make, read on.
1. Cap Rate: The Market Benchmark Metric
Cap rate remains one of the most widely referenced measurements in real estate investing because it instantly tells you whether a property's income aligns with its price.
Cap Rate = Net Operating Income ÷ Purchase Price
But cap rate has no meaning in isolation. It's a contextual metric that shifts dramatically based on geography, taxes, policy changes, and rent trends. A cap rate that looks impressive in Los Angeles might be considered substandard in Dallas — and vice versa.
Research from ATTOM and CBRE shows that major U.S. metros fall into distinct cap rate bands:
- West Coast markets: 3–5%
- Sunbelt markets: 5–7%
- Midwest cash-flow markets: 6–9%
This is why investors must compare a property's cap rate not to a national "rule of thumb," but to local operating norms. Rising insurance costs, particularly in Florida and Texas where premiums have surged 20–33% YoY, can compress NOI instantly, turning what looks like a 6% cap rate today into a 4.5% cap rate next year.
Cap rate helps you understand:
- Whether the property aligns with realistic market expectations
- Whether you're paying too much for the income it generates
- Whether you're stepping into an unfavorable risk-return profile
Instead of relying on seller assumptions, Serava applies real expense benchmarks and updated regional trends, giving you a far more accurate cap rate than manual models.
2. Cash Flow: The Investor's Lifeline
Cash flow is the engine of real estate investing. In fact, according to the BiggerPockets State of the Market Report, 67% of investors rank cash flow as the #1 factor in their decision-making. Cash flow is what stabilizes your portfolio, funds your reserves, fuels additional acquisitions, and buys you time for appreciation to compound.
But true cash flow isn't the simple "rent minus mortgage" formula beginners use. It is a detailed financial model that accounts for every recurring and variable cost tied to the property.
The correct cash flow formula includes:
- Mortgage
- Property taxes
- Insurance premiums
- Maintenance reserves
- Vacancy expectations (typically 5–8%)
- Professional management
- HOA fees
- Utilities
- Turnover and CapEx planning
Studies from Buildium reveal that 45% of investors underestimate maintenance and turnover costs, which can erase thousands in projected annual returns. Couple that with property tax reassessments — particularly aggressive in Texas, often rising 10–25% after a sale — and the picture becomes even more precarious.
This is precisely why investors who manage multiple assets use modeling tools rather than intuition. Serava's cash flow engine layers in regional tax, insurance, and operating cost benchmarks so your projections reflect what the property will cost — not what you hope it will cost.
3. Cash-on-Cash Return: The Real Investor ROI
While cap rate evaluates the deal, cash-on-cash return evaluates you — specifically, the return you're getting on the actual dollars you put into the investment.
CoC = Annual Cash Flow ÷ Total Cash Invested
This metric is essential because it influences:
- Capital allocation strategy
- Portfolio scaling feasibility
- Cash recycling speed
- Financing structure decisions
- Exit timelines and long-term projections
In higher-rate environments, COC becomes harder to maintain. A Freddie Mac study showed that a 1% increase in mortgage rates can reduce cash-on-cash returns by 10–15% depending on leverage.
CoC is where the difference between good underwriting and bad underwriting becomes painfully visible. Investors who overestimate rent, underestimate vacancies, or ignore rising insurance premiums will see their COC collapse after acquisition. This is exactly why serious investors rely on automated, data-backed tools to model CoC with real-world accuracy.
4. Total ROI: The Number Most Investors Ignore
Total ROI is the deepest, richest measure of investment success — yet ironically the one investors understand the least. While cash flow dictates your monthly comfort, ROI reveals the true, long-term wealth-building potential of the asset.
Total ROI reflects:
- Cash flow
- Appreciation
- Loan principal reduction
- Tax benefits
- Expense inflation
- Rent growth
- Market-level performance trends
In 2024, CoreLogic reported 6.3% YoY national home price growth, with many Sunbelt cities exceeding 8–10%. When combined with mortgage amortization — which pays down principal every month — the majority of an investor's long-term wealth often comes from forces unrelated to monthly cash flow.
Many investors are shocked when they use Serava's Portfolio Dashboard for the first time and see that some of their "best cash-flow deals" underperform over a 5-year horizon, while some modest-looking properties deliver far stronger IRR thanks to appreciation and amortization.
Total ROI is what separates investors who build a few rentals from those who build generational wealth.
5. Common Mistakes Investors Make (That You Should Avoid)
The same themes surface repeatedly across surveys, investor case studies, and underwriting audits. The biggest failures come from predictable, preventable mistakes such as:
❌ Using inflated rent projections
Zillow's 2024 rental report shows that actual rents often differ by 5–12% from estimates if investors rely solely on listing platforms.
❌ Ignoring long-term expense increases
Insurance hikes in FL/TX, 10–25% tax reassessments in certain counties, and inflation-adjusted operating costs almost always rise faster than investors model.
❌ Underestimating maintenance
Buildium reports that nearly half of investors under-budget maintenance by 30–40%.
❌ Forgetting professional management costs
Even DIY owners eventually outsource — and management fees impact NOI significantly.
❌ Not stress-testing vacancy
With a 6.6% national vacancy rate, underwriting with 0–2% is wishful thinking.
❌ Trusting seller pro formas
Pro formas are sales documents, not underwriting models.
Serava helps eliminate these issues by grounding every input in validated data through the ROI Calculator (/roi-calculator), ensuring underwriting reflects actual operating reality, not speculation.
Conclusion
ROI, cap rate, and cash-on-cash return are more than metrics — they are the foundation of sophisticated real estate investing. When understood and applied correctly, they give you clarity, control, and a competitive advantage in a market where most investors are still guessing.
To explore which tools fit your investment strategy, visit Pricing.
Related Reading
- How to Analyze a Rental Property in 2025
- The Hidden Variables That Quietly Destroy Real Estate Returns
- Why Most Real Estate Investors Don't Lose Money — They Lose Time
And if you're ready to take the next step toward disciplined, data-backed investing:
Create your Serava account today.
This is how serious investors invest — with math, discipline, and insight.
Ready to analyze deals like a pro?
Start using Serava to analyze rental properties with data-driven insights, automated ROI calculations, and professional-grade risk analysis.